Construction managers are visual thinkers. You manage projects by walking around them, talking to people and seeing for yourself where the work stands. But is that enough?
At some point, project and teams are simply too big to manage on gut reactions to what can be witnessed in person. This is where data can help. You can spot trends farther in advance by intelligently using data.
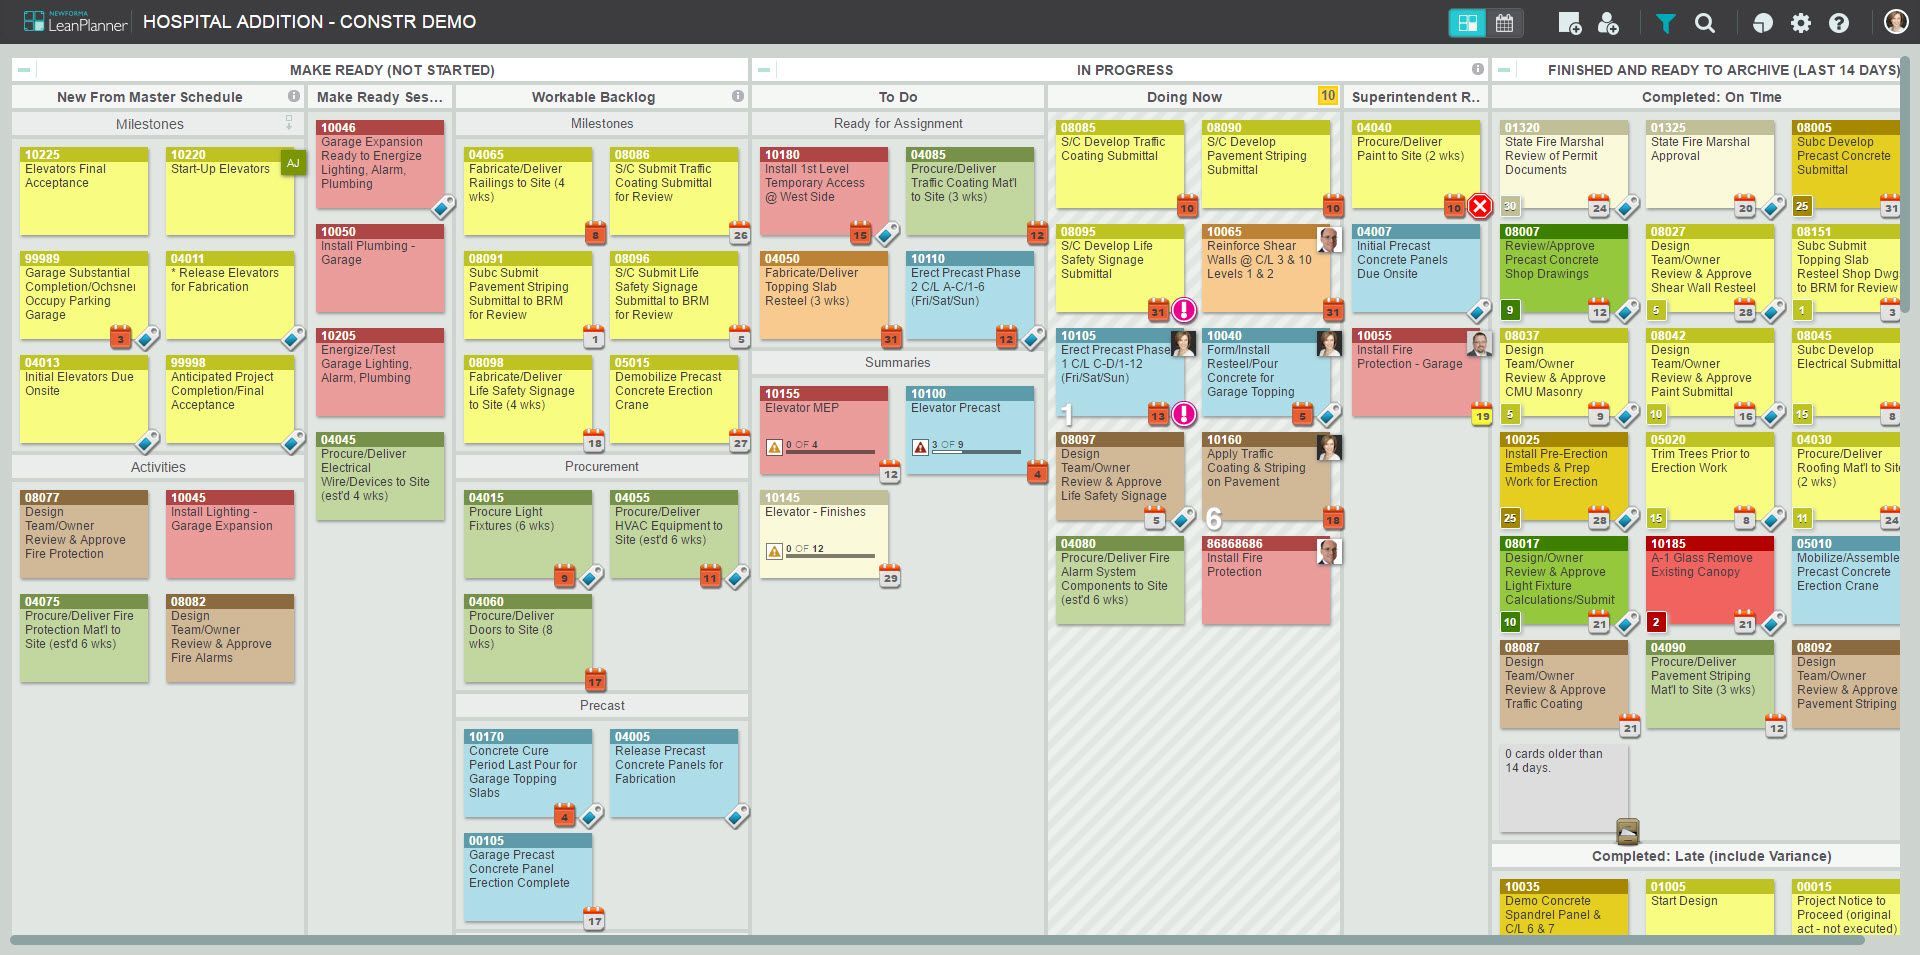
Enter lean design and construction. Lean relies on visual displays, too, such as colored cards on boards, each card displaying a trade and each location showing a phase of work.If you use lean construction kanban boards, you know what I mean.
Reports can be pictorial, too.
Equally important to lean construction–and possibly overlooked–are the reports generated by the movement of those cards across the board.
For most people, visual displays of information are easier to read than tables in spreadsheets. This Newforma LeanPlanner graph displays how smoothly work is flowing through a process–and the pace to complete existing work.Each movement of a card generates data that provides insights into constraints on work, variances to the schedule and what percentage of work is being completed as planned. Each of those three metrics is gold to the project manager or superintendent eager to see more than steel, concrete and hardhats.
It’s these lean metrics that provide deep insights and views far enough into the future to foresee problems while they’re still manageable.
If you’re using paper sticky notes as kanban cards, you have to manually enter data into a spreadsheet to obtain your reports. Manual data entry takes time and risks errors.
http://newforma.wistia.com/medias/g2t56oegyj?embedType=async&videoFoam=true&videoWidth=680
By contrast to manual data entry, software such as Newforma® LeanPlanner automates the capture and display of data. It’s immediate, accurate and pictorial.
Every picture tells a story.
Software beats sticky notes when it comes to immediate, accurate reports. In this chart, managers can see how often they are meeting their scheduling commitments, a key step to improving reliability and preserving the schedule.In this guest blog post at the Newforma website, LeanKit Vice President Bob Batcheler writes about the virtues of being able to see what team members are doing. He shares a graph generated by Newforma LeanPlanner software, powered by LeanKit, saying this about the graph:
Newforma LeanPlanner collects information about the movement and status of cards as the work items move through the work process. That data informs easy-to-generate analytics that managers use to assess ongoing project performance, which is another form of situational awareness.
For more, read the blog Making Knowledge Work Visible.
Read Making Knowledge Work Visible